Chapter 5 Results
5.1 US Presidential Election
In the U.S., a presidential candidate needs to receive a minimum of 270 out of 538 electoral votes to win the election, therefore every state matters in determining the election results. Also, with a “winner takes all” system implemented in all states except for Nebraska and Maine, popular votes are important since all the electoral votes of a state go to the candidate with the most popular votes. Based on the published voting results, we carried out extensive analysis on 2020 US Presidential Election to take a closer look at the popular votes received by two candidates on the state level. You can also go to Fox News to see detailed electoral vote results.
5.1.1 2020 Election Margins by State
The first map displayed Democrats’ presidential margins, i.e. difference between Dem. vote shares and Rep. vote shares, in each state. We cut the margins by -0.5 and 0.5, but if zooming in to the Virginia-Maryland region, we can see Biden’s margin in D.C was larger than 0.5 (equal to 86.75%). Besides winning a landslide victory in D.C., Biden also won Vermont, Massachusetts, and Maryland with a margin larger than 30%, whereas Trump won Wyoming, West Virginia, North Dakota, and Oklahoma with absolute advantages. These states are clearly either blue or red, but there are also several states with a very narrow margin that are shown in the middle white color. Hot races took place in Florida, North Carolina, Georgia, Arizona, Wisconsin, Pennsylvania, Nevada, and Michigan where the margins of the winning party were less than 5%.In general, we can see Biden’s advantage in the West Coast and the Northeast of the US while Trump’s advantage in the Southwest and the Central America. In terms of the number of states won, Biden won 26 states and Trump won 25 states, but the number of electoral votes made a big difference in the final results.
You can see more detailed vote share margins by county in the interactive component chapter
Comparing election results between 2016 and 2020, we found:
- There were noticeable margin shifts in many states, which most of these states voted for Hillary Clinton in 2016 and futher expanded Democrat’s margin in 2020. The margins in Vermont and Colorado shifted the most by 9% (26.41% Dem -> 35.40% Dem) and 8.6% (4.91% Dem -> 13.5% Dem) respectively.
- Joe Biden enlarged the margins in a couple of battlegrounds that Hillary Clinton won in 2016: Minnesoda (1.52% Dem -> 7.11% Dem) and New Hampshire (0.37% Dem -> 7.35% Dem).
- Joe Biden flipped 5 states that Donald Trump won in 2016, which are displayed in the plot below.
We filtered the five flipped states, and the changes in popular margins are: Michigan (0.23% Rep -> 2.78% Dem), Pennsylvania (0.72% Rep -> 1.16% Dem), Wisconsin (0.77% Rep -> 0.63% Dem), Arizona (3.55% Rep -> 0.31% Dem), and Georgia (5.13% Rep -> 0.24% Dem). Among them, Georgia had the most margin shift.
5.1.2 Historical Timeline
5.1.2.1 Trace Election Margin Shifts Over Years
We compared how vote shares have shifted in elections from 1976 to 2020 Instructions to use the graph:
- Play/pause clicking the play/pause button
- Play/pause by hitting space
- Navigate the motion slider by dragging the slider thumb
- Navigate the motion slider by hitting the left and right arrow keys Please refer to the wiki here for more information about motion highcharts.
This motion map shows that initially the left half of the map was red and the right half was blue. From 1980 to 1988, red (Republicans) has dominated this map. Especially in 1984, almost all states were red (except for Minnesota and note that Minnesota has always been blue from 1976 to 2020). Also, from 1992, the “red states” and “blue states” became more stable, and only a few were swing states.
However, pesidential candidates of the US winning more popular votes did not always win the election. “It is possible the candidate with the most votes from the public won’t be the winner. This is because the president is not chosen directly by the voters, but what’s known as the electoral college.” (This is explained by BBC.) Thus, In this part, we compared popular vote shares vs. electoral college vote shares in US elections since 1900.

Note: axes of the plot do not start from 0 as usual since we want to reduce point overlapping and zoom in to the area that contains all points of interest. From the plot above, we can see:
- Each point in the plot represents a winner of the US Presidential Election and the axes show the popular and electoral vote shares of the winner in the respective election year. All points fall above the horizontal line y = 50% since every president-elect obtained more than half of the electoral votes to win the election.
- Ideally, we hope the president-elect also had high share of popular vote. However, the data points falling in the red rectangle were not this case. There were outliers in the plot, for example, in the years 1912 and 1992, Wilson and Clinton won the election of the time with high electoral vote shares, but their popular votes shares were lower than 45%. Trump in 2016 also won the election with more electoral votes but fewer popular votes.
- Additionally, we can see Reagan in 1984, Roosevelt in 1936, and Nixon in 1972 won the elections with overwhelming support that their shares in both electoral votes and popular votes were very high.
5.2 Contribution Receipts Data
5.2.1 Where Contributions Came from
5.2.1.1 Overview: Total Contributions by State
As an overview, we plotted the total amounts of contributions made by each state this year that were received by all presidential candidates of 2020 US election.
As shown in the map above, California has contributed the most to all presidential candidates in 2020 US Election, which exceeded 260 million US dollars. Contributions from New York, Texas, and Florida were also significant. On the other hand, North Dakota, South Dakota, and Wyoming have made the least contributions to all presidential candidates, probably because of their small populations.
5.2.1.2 Biden vs. Trump: Contributions by State
The bar chart above displays how much Joe Biden and Donald Trump have raised in each state in 2020, and it is sorted by the amounts of Joe Biden’s raisings. You can zoom in to see each state’s contribution amounts in detail. Joe Biden received solid support from California and New York which contributed 127M dollars and 63M dollars respectively, more than twice as contributed to Donald Trump. Besides receiving 58M dollars from California, Donald Trump also raised significant amounts from Texas and Florida equal to 52M and 48M dollars respectively, much more than Biden. We found that these are consistent with the final voting results as Biden has won California and New York with a margin larger than 20% whereas Trump won Florida and Texas, two of the battleground states.
5.2.1.3 Biden vs. Trump: Contributions Per Registered Voter by State
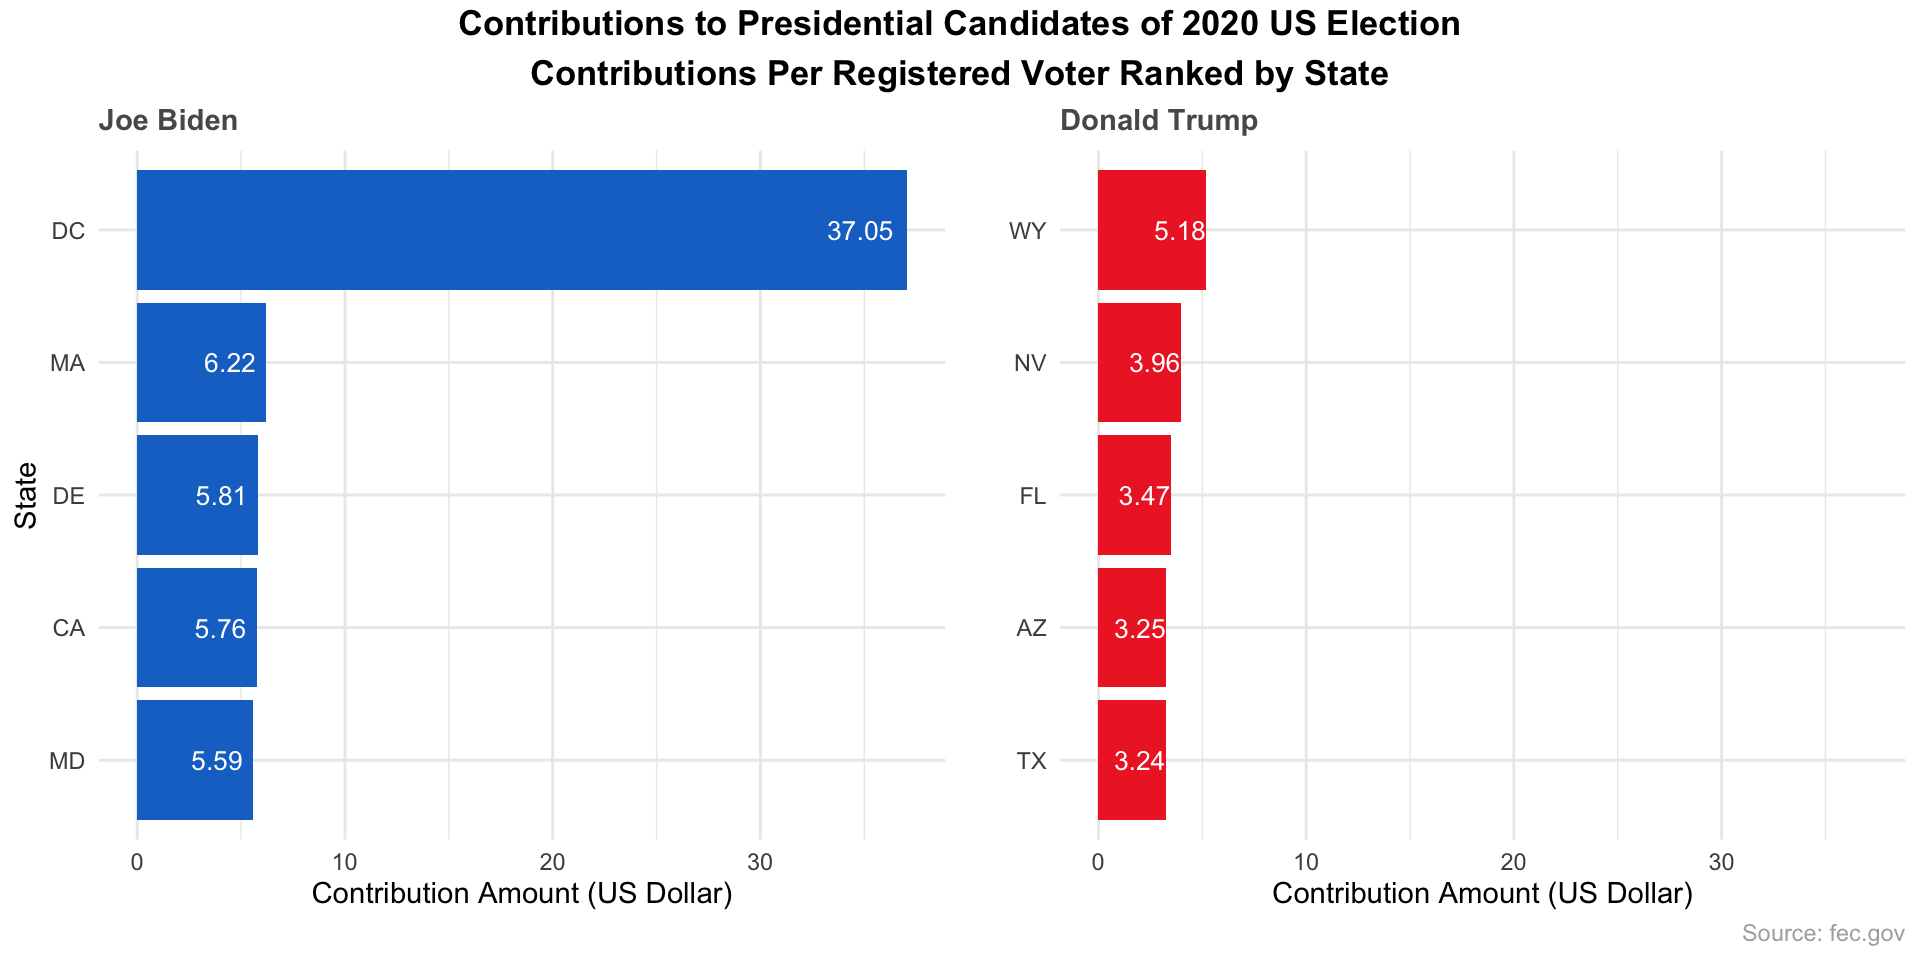
If we instead take into account the registered voters in each state and calculate contributions per registered voter, we can see District of Columbia is clearly an outlier. It has the highest average contribution to Biden equal to 37 dollars per registered voter, way more than any other state. Remarkably, in the election Biden won 93% of total votes in DC. In addition, Wyoming surprisingly has contributed the most to Trump on an average level. After researching online, we found that Wyoming has the lowest percentage of registered voters among all states that only 47.4% of its population registered to vote, and this explains Wyoming’s higher average contribution. Its support for Trump was reflected on the voting results that Trump won the state with a margin over 40%. In fact, Biden has won all five states (DC, MA, DE, CA, and MD) listed on the left of the plot above which has made the most contributions per registered voter, and his margins of victory in these states were . Trump has won four of the five states (WY, FL, AZ, and TX) listed on the right of the plot above except for Nevada. Trump lost Nevada by 2.4% vote share.
5.2.2 Individual Contribution Distribution
| Candidate name | Number of contributions | Total raised amount (Million US Dollars) | Mean contribution (US Dollars) | Median contribution (US Dollars) |
|---|---|---|---|---|
| BIDEN | 644,429 | 389.6 | 604.62 | 300 |
| TRUMP | 302,275 | 191.4 | 633.24 | 375 |
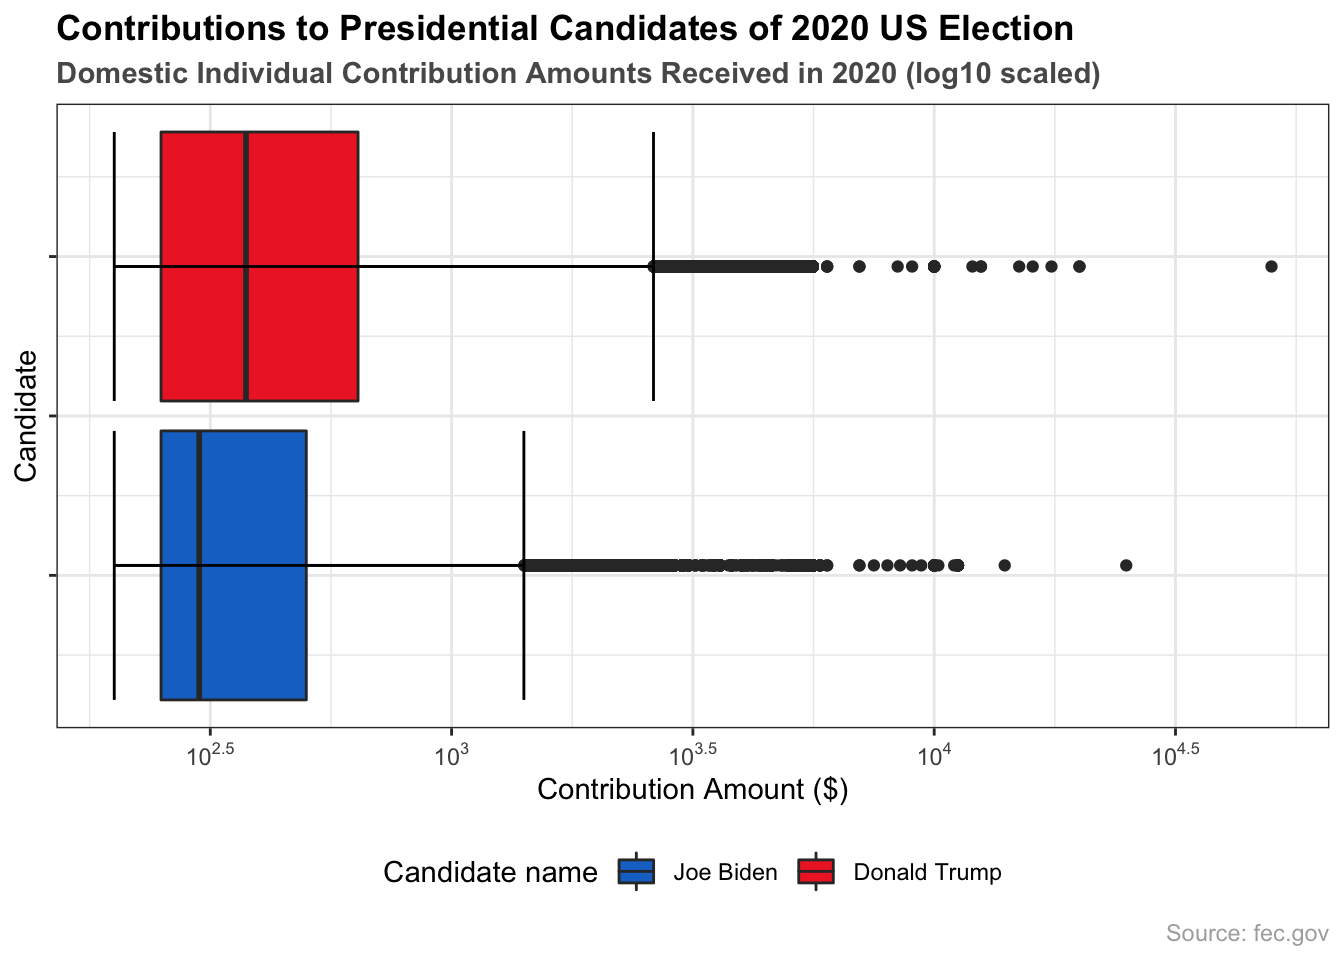
Figure 5.1: Domestic Individual Contribution Distribution
To see more contribution details, we selected from the original data the domestic individual contributions with amounts higher than 200 dollars received by two presidential candidates. As shown in the contributions summary table, Biden received double the number of contributions and the total amounts of funds as Trump did, but the mean and median contributions to Trump are higher than to Biden. The log10 scaled boxplot above also demonstrates the difference in median contributions, and in addition, it shows that the contributions distributions for both candidates are largely right skewed with a good number of outliers. This makes sense as the majority of individuals contributed less than 500 dollars.
5.2.3 When Contributions Were Made
We also grouped data points by receipt date and calculated the daily raisings of each candidate from January 1, 2020 to October 15, 2020, which are shown as the plot above. It is clear that Joe Biden generally raised more funds than Donald Trump. We marked on the plot the major events when there were peaks in raisings of both candidates. A small peak of Biden’s raisings in the early March was prominent, and this paralleled Biden’s win in the South Carolina Democratic presidential primary along with Michael Bloomberg’s quit, which we learned from the news of the time. More notably, Biden achieved greater success in fundraising from mid-August, and Biden’s daily raisings hit the 13.6M dollars on August 20, 2020 by the time he officially accepted the Democratic nomination. On September 30, the next day of the first Presidential Debate, Joe Biden secured another huge funding of 12.2M dollars, which to some extent reflected people’s choice. Although Donald Trump also received more funds in the second half year, the contributions to Trump did not significantly increase as the election season approached. Trump’s peak in daily raisings of 4.9M dollars was reached on August 27, 2020 when he officially accepted the Republican nomination, but the amount was much less than that raised by Biden.
5.2.4 Who Contributors Were
To obtain a better understanding about individual contributors, we extracted keywords from contributors occupations and separated them by candidate, so that we were able to draw a word cloud for each candidate.
5.2.4.1 50 most popular contributor occupations: Joe Biden vs. Donald Trump:


To display words properly, the size of words in word clouds was scaled by extracting a cube root of the word frequency count. The blue word cloud on the left for Joe Biden clearly showed that a great proportion of contributors were not employed, and attorney, physician, engineer, and manager were also popular occupations. In contrast, the red one on the left for Trump displayed the word retired most prominently, which implied that contributors who have supported Trump were dominantly retired. Besides, entrepreneur, owner, and manager were popular occupations. We chose word clouds to provide an overview of all popular job titles, but since it is harder to judge the size of texts, we generated a bar chart below that enables better comparison between the actual frequency counts.
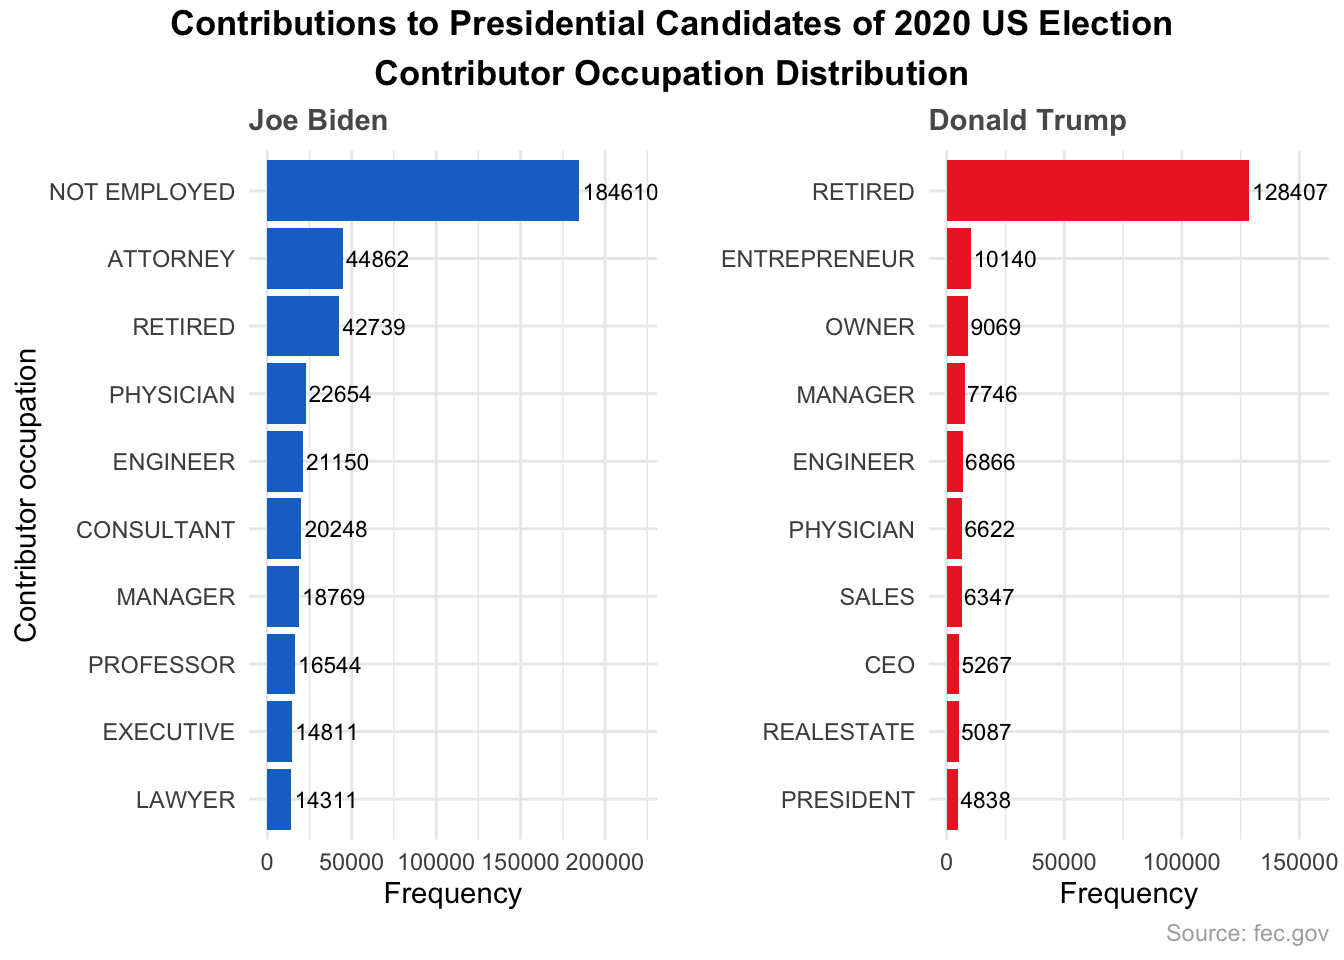
Comparing the difference between two candidates, more than half of 10 top occupations of Joe Biden’s contributors are legal or technical professional positions, whereas more than half of 10 top occupations of Donald Trump’s contributors are positions in business.
5.3 Disbursement Data Analysis
5.3.1 Who Spent the Most
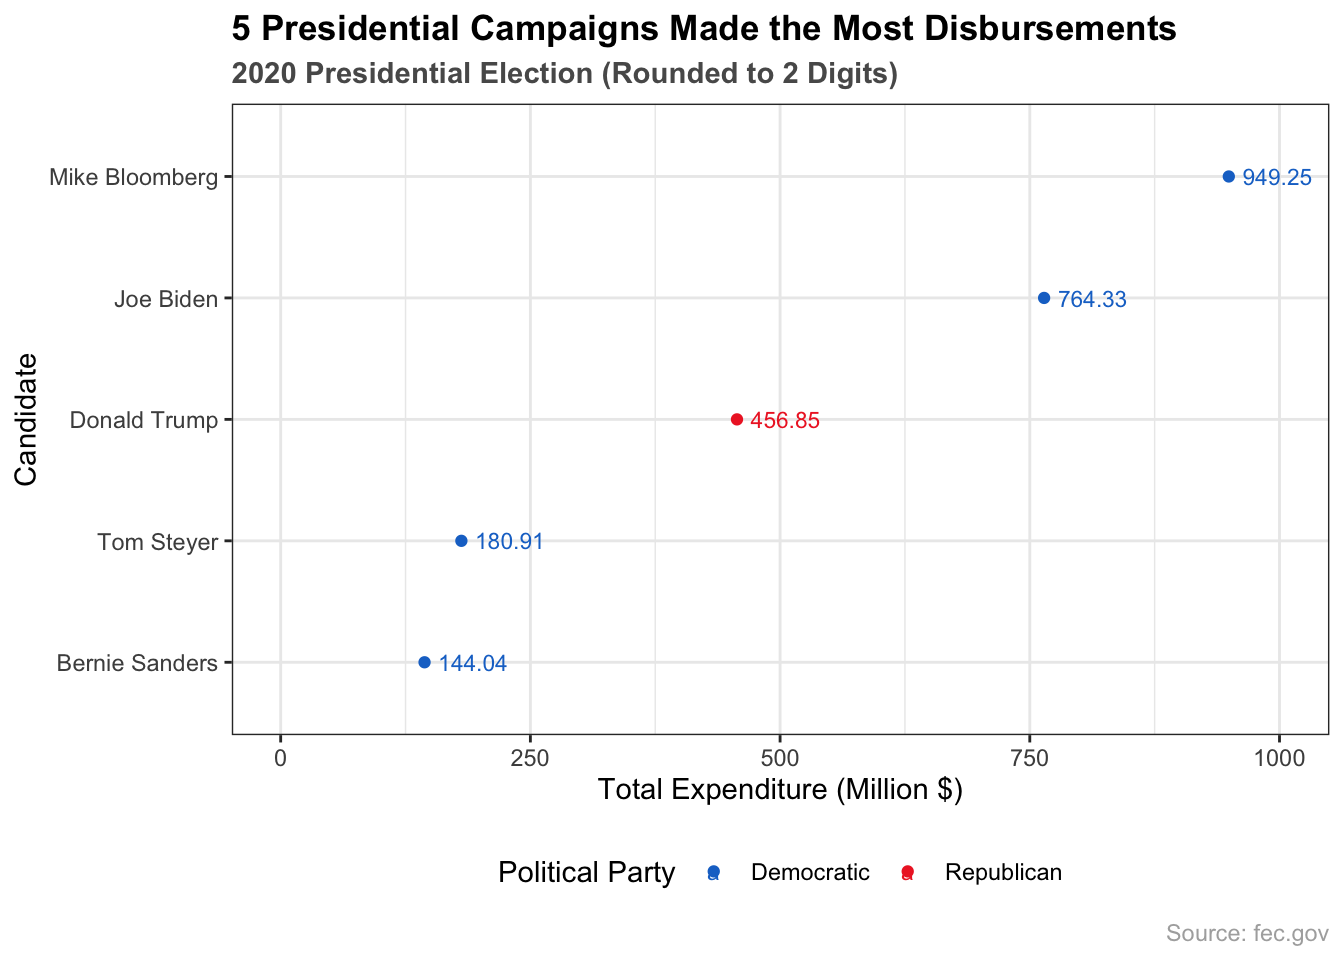
Among 5 committees that spent the most during this year, 4 of them are Democratics, and only Donald Trump is Republican. This might relate to facts that the Democratic party has received more contributions than the Republican party, and also that there was little competition inside the Republican party as Trump ran for re-election. One interesting finding is that Mike Bloomberg’s Committee spend the most among all of the committees, and this is not expected since Bloomberg quit the election race very early in March 2020. According to the article from The Guardian, all of those expenditures came from Bloomberg’s personal fortune instead of campaign contributions. Therefore, we treated Mike Bloomberg’s campaign as an outlier. Joe Biden’s committee and Donald Trump’s committee were as expected the next most-spending campaigns, but Biden has spent 300 Million dollars more than Trump.
5.3.2 What They Spent Money for
The stacked bar chart above shows the percentage of total disbursements spent on each category for the 5 most-spending campaigns. Committees spent the most on Advertising, while other expendituress were relatively trivial. Under the COVID-19 pandemics, candidates seemed to spend more on virtual services and canvass voters with mass public advertising rather than making campaign trips. As a result, disbursements in Travel/Events/Materials were particularly low. Also, we can see their spending strategy from the plot. Among the five candidates, Biden has spent the most, both in the proportion of total expenditures and in the dollar amount, in Advertising. On the other hand, Trump’s and Bernie’s election campaigns paid more for publicity items relative to other candidates that they prepared and purchased more campaign materials such as flyers, postcards, and pens for traditional campaign trips. Instructions to use this treemap:- Hover over a color to see spendings on a category.
- Hover over a tag to see full recipient name.
- Click on a color to select a spending category. Note: We tried to display the full names of companies, but many squares are small that we were not able to show names properly. However, you can move the mouse over a tag to read the full company name.
Going further from what we have discovered, we created the treemap above to find which companies were the top recipients and what services they have provided. As discussed before, advertising expenses were the largest expenditures for all candidates, and media agencies like Media Assembly and Media Buying & Analytics.LLC were major media buying service providers for candidates of the 2020 election. As expected, Google and Facebook were also among the top recipients as candidates largely leverage search engines and social media. There were also disbursements for administrative and consulting purposes. For example, Zenefits, Vensure HR.LLC, and ADP.LLC provide Human Resource supports like H.R. Management software systems. Presidential election committees also purchased consulting, financing, and other services to run the election, and you can click on the plot to see more details.
5.3.3 Biden vs. Trump: Disbursement Distribution
Focusing on the two final presidential candidates of 2020 US Election, we took a close look at their expenditure details.
| Committee name | Number of Records | Total spending amount (Million US Dollars) | Mean spending amount (US Dollars) | Median spending amount (US Dollars) |
|---|---|---|---|---|
| BIDEN FOR PRESIDENT | 52,037 | 764.6 | 14,693.74 | 250.0 |
| DONALD J. TRUMP FOR PRESIDENT, INC. | 26,196 | 457.1 | 17,449.47 | 201.6 |
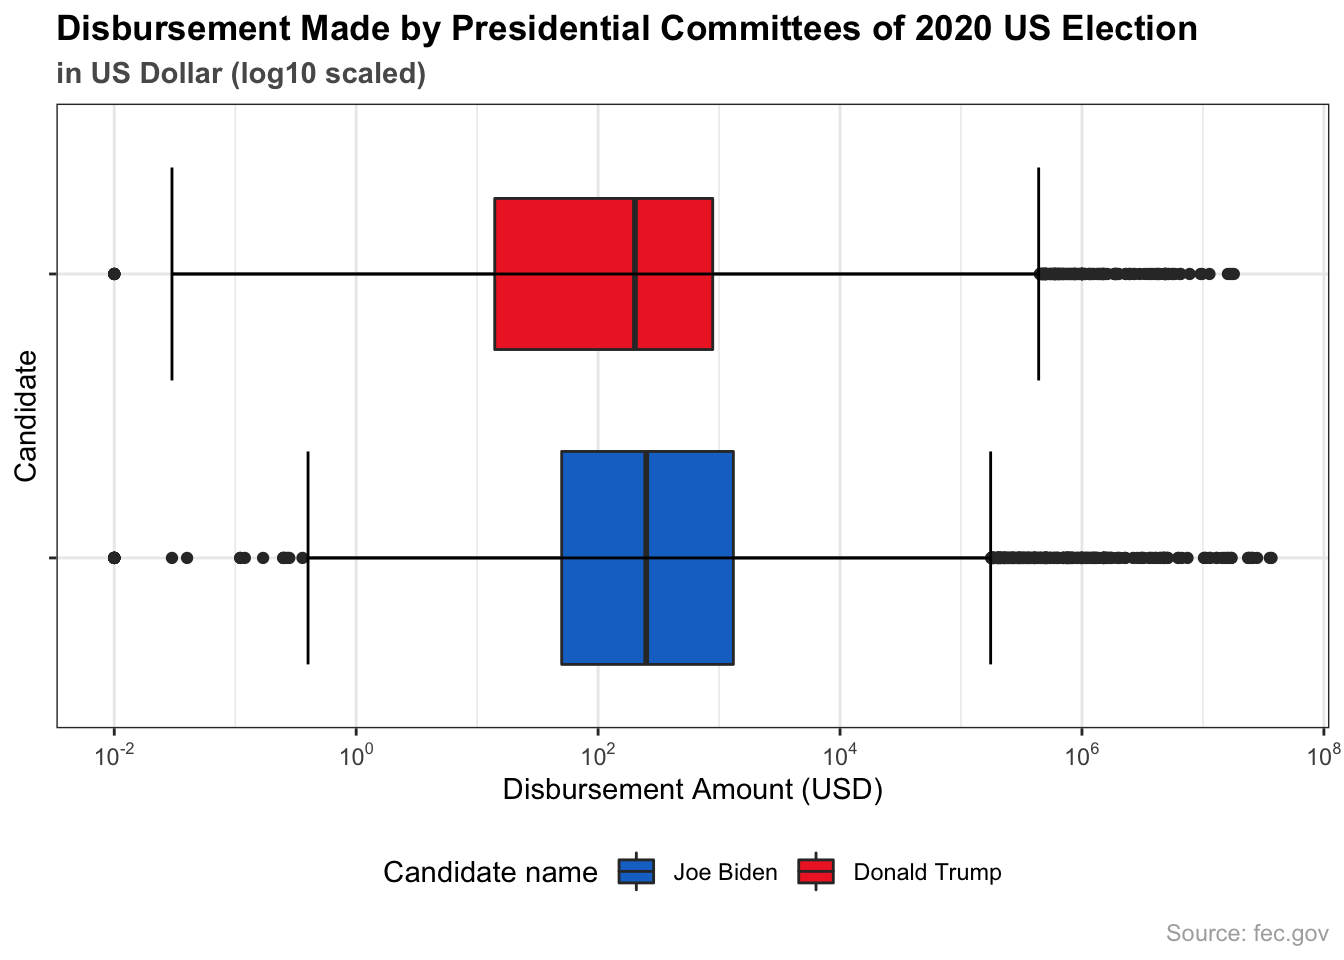
From the table above, it is clear that Biden spent 300 million dollars more than Trump. In the boxplot, we used the log10 scaled x-axis to reduce skewness of the disbursement distribution, but there are still many outliers on the right tail. Also, there are single expenditure records for both candidates with an amount larger than 10 million dollars. The median expemditures were similar for two candidates.
5.3.4 Biden vs. Trump: When they spent the most
5.3.4.1 Spending Trend of Two Committees
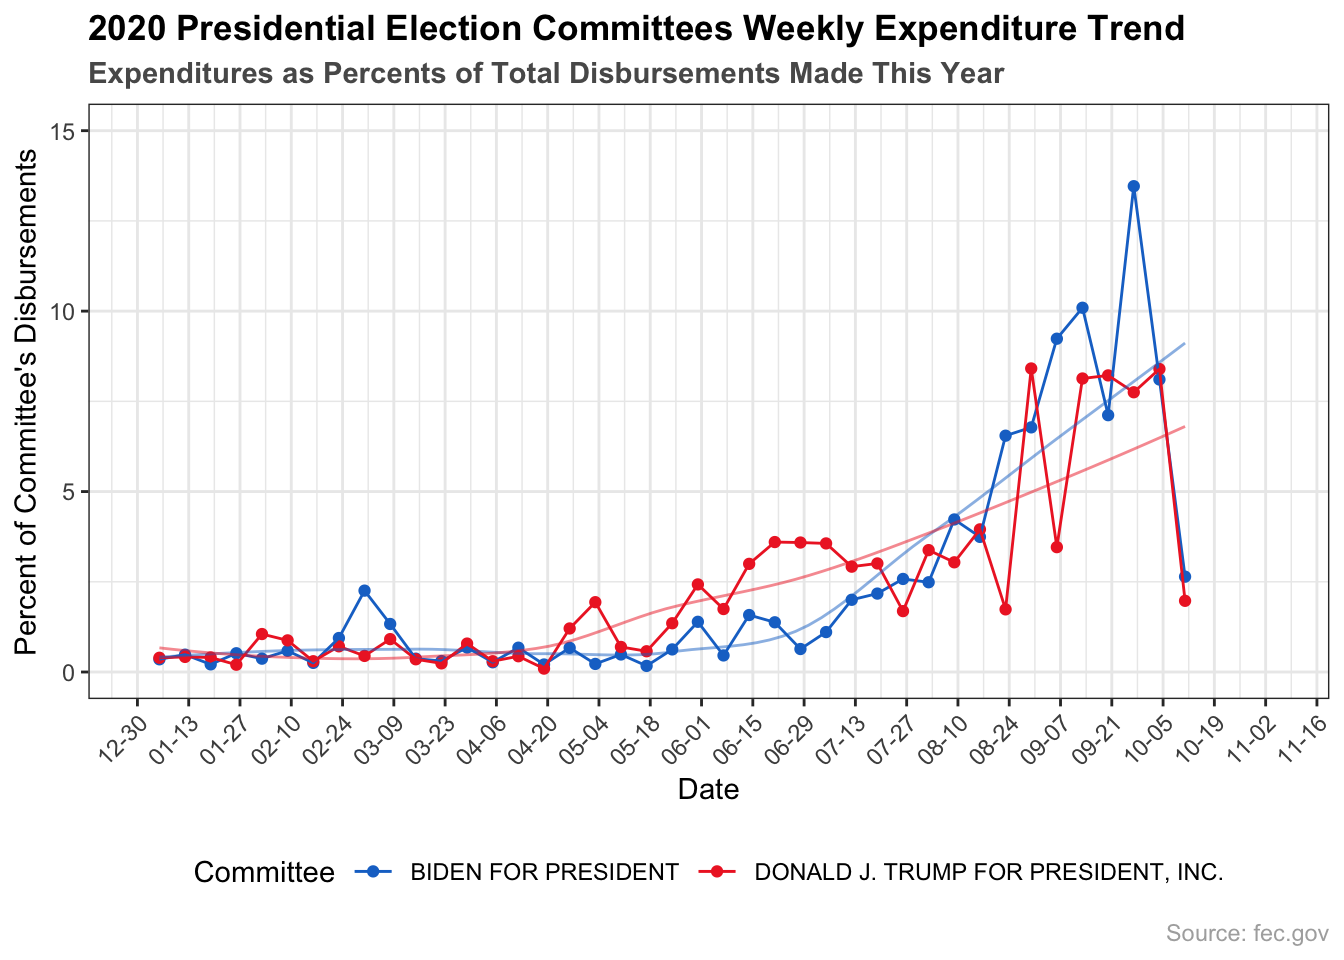
The time series plot shows weekly spending as a percentage of total disbursements made by the two presidential committees in 2020. It is clear that both committees spent more as the election day approached. Trump election committee started in late April to invest money in campaign activities, whereas Biden did not seem to start until late May, 2020. There were some peaks in Trump’s committee spendings in early May, late June to early July, and early September to early October. Those corresponds to the cost of launching the Trump election game app, releasing digital ads to praise his policy on COVID-19 and attack Biden’s statements respectively (information source: ballotpedia.org) On the other hand, major disbursements of Biden election committee came later but grew more rapidly. The first peak in the blue trend line appears in late February to early March. According to the presidential committee activity timeline provided by ballotpedia.org, that corresponds to Biden’s first largest $12 million ad buy. Another peak of Biden’s spending trend line was in late September to early October, which the expenditures of the week took more than 13% of total disbursements this year. Comparing to Trump, Biden’s committee seeme to become more active as the election day approaches.
5.3.5 Biden vs. Trump: Disbursements by State
The two maps above show how much Biden and Trump have spent in each state, and please note that the legends are in log scales. We can see the efforts they have put in some battlegrounds states, and it seems that neither of them has made significant investments to states in the central America. Biden spent the most in Georgia which was equal to 360.8 million dollars, and he also spent significant amounts in New York, California, Pennsylavania, and Massachusetts. Among these states, Biden successfully flipped and won Georgia and Pennsylavania which Democratics lost in 2016. On the other hand, Trump invested the most in Virginia, New York, New Hampshire, Louisiana, and Florida. Trump spent 347.6 million dollars in Virginia, 21.3 million dollars in New York, and 11.0 million dollars in New Hampshire. Trump’s expenditures in Virginia were more than 10 times of the amounts spent in New York, but unfortunately he lost Virginia by a 10% margin. When looking at other three flipped states Michigan, Wisconsin, and Arizona, we were surprised to find out that Trump has invested more than Biden in all three states.
From this, it seems that Trump’s spending strategy was not effective in helping him win key states. His spendings on public rallies and campaign materials during a pandemic did not bring him significant votes he needed.